Scanning Potential Energy Surfaces
Transition states can be localized in many cases through scanning one structural degree of freedom. This will, of course, only be successful if the reaction pathway can be described by essentially ONE structural parameter. In order to cover the relevant part of a potential energy surface, a series of calculations must be performed in which one of the structural parameters is fixed to a certain value, while all other parameters are optimized to their most favorable values. This relaxed potential energy surface scan can be performed automatically in either a Z-Matrix or redundant internal coordinate system. Both options will be illustrated using the rotational transition state in hydrogen peroxide (H-O-O-H) as an example:
1) Coordinate Driving in Internal Coordinates
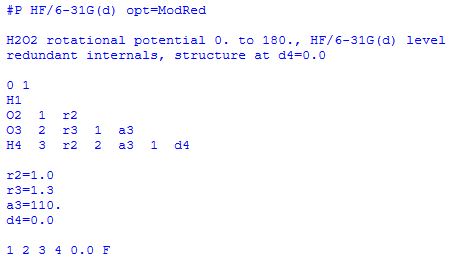
The following is a Z-Matrix describing the hydrogen peroxide molecule together with its structural variables:
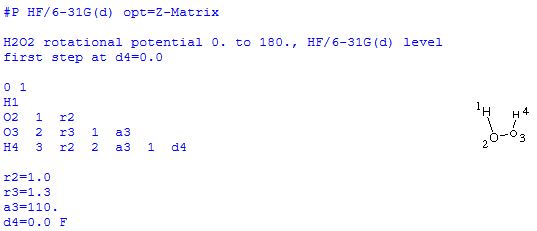
The last line of the Z-Matrix describes a value of 0.0 degrees for the H/O/O/H dihedral angle d4, the tailing character F indicating that this variable is frozen and not to be varied during the geometry optimization. Once the (partial) geometry optimization has completed, a series of additional partial geometry optimizations can be performed, fixing the H/O/O/H dihedral angle to larger and larger values. A complete rotational potential can thus be calculated through a series of separate, constrained geometry optimizations, varying the dihedral angle d4 from 0.0 to 180.0.
The same final result can be achieved in a single job using the following input:
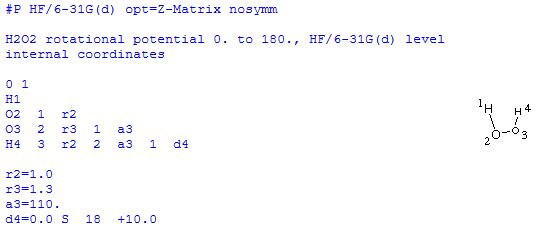
The last line of the Z-Matrix again describes an initial value of 0.0 degrees for the H/O/O/H dihedral angle d4 but also specifies a Scan of 18 steps, in each of which the dihedral angle d4 is varied by +10.0 degrees. In order to avoid problems caused through changes in the point group along the pathway (C2v at d4=0.0, C2 for d4=+10.0 - +170.0, C2h at d4=180.0) the nosymm keyword has been added. The choice of internal coordinates ensures, however, that both O-H bond distances as well as both H-O-O bond angles are identical all along the pathway.
Gaussian performs a series of constrained optimizations, writing the results of all of these optimizations to the standard output together with a summary of the overall results:
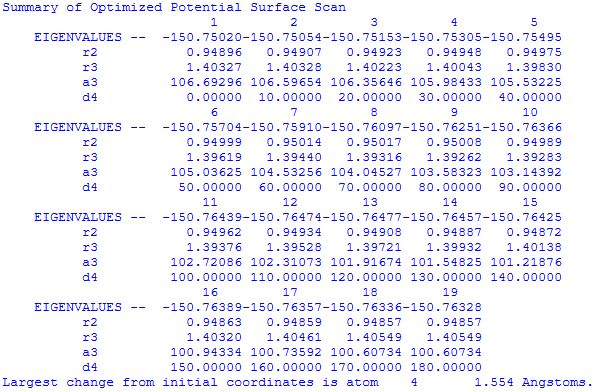
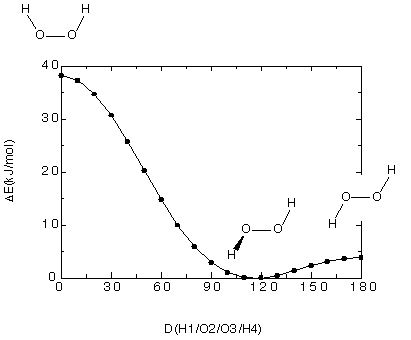
In this particular case the energetically most favorable structure is the one at 120.0 degrees with an energy of -150.76477 Hartree. The structure at 180.0 degrees is only slightly less favorable at -150.76328 (+3.9 kJ/mol), while the structure at 0.0 degrees is substantially less favorable at -150.75020 Hartree (+38.3 kJ/mol). Given the symmetry of the molecule, the structures at 0.0 and 180.0 degrees are therefore transition states with respect to rotation around the central O-O bond. The following figure gives an overview over this part of the potential energy surface:
2) Coordinate Driving in Redundant Internal Coordinates
The Z-Matrix used in the previous input file for internal coordinates can also be used for the redundant internal coordinate definition. All that is required to perform constrained geometry optimizations in redundant internals is the modification of the opt keyword:
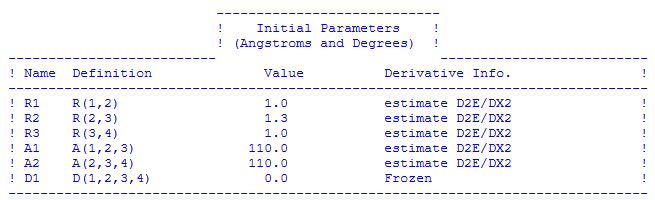
The modified keyword opt=ModRed leads the program to read additional input after specification of the structure of the system. This information is given on separate lines, one constraint per line. In the current example the dihedral angle specified through the centers 1, 2, 3, and 4 is set to 0.0 degrees and frozen to this value during the geometry optimization. That the dihedral angle defined through atoms 1/2/3/4 is indeed constrained to one value is visible in the list of redundant internal coordinates at the beginning of the output file:
As in the Z-Matrix example before, a complete rotational potential can be constructed by performing a series of constrained optimizations with different values for dihedral angle 1/2/3/4. A complete relaxed rotational potential can be calculated in redundant internals in one calculation using the following input:
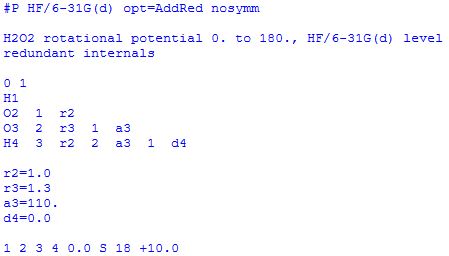
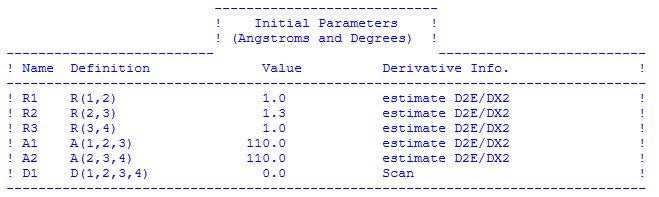
The keyword options opt=AddRed and opt=ModRed produce identical results and are synonymous. The calculations performed in this case are very similar to those performed before in the internal coordinate system. That the dihedral angle defined through atoms 1/2/3/4 will be scanned is visible in the list of redundant internal coordinates at the beginning of the output file:
Again a summary of the potential energy surface scan is given at the end of the output file containing all geometrical parameters as well as the energy for each of the optimized points.
3) Driving a Bond Angle to Study Hydrogen Migration
Driving a bond angle can also be used to study the potential energy surface of reactions, the isomerization of HCN to CNH being a nice example. An input file for studying this system in internal coordinates at the HF/6-31G(d) level of theory is:
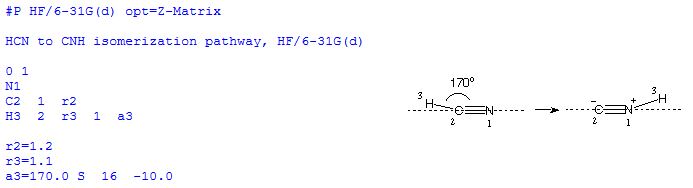
The scan starts in this case at 170.0 degrees in order to avoid problems related to the linear arrangement of atoms and the higher symmetry of the reactant and product structures at a3=180.0 and 0.0 degrees. For the same reason the scan only covers 17 steps (including the starting structure) and ends at a final value of a3=10.0 degrees. With the input file listed above the final summary provided by Gaussian is:
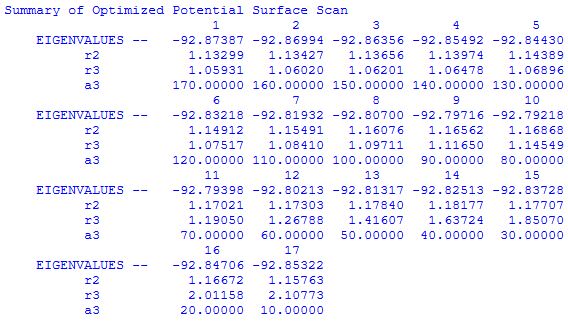
According to the energies listed in this summary the transition state for this rearrangement is located at a bond angle of around 80.0 degrees. In order to pin down the location of the transition state more precisely, a second scan should be performed in which the bond angle a3 is varied between 90.0 and 70.0 degrees in smaller step sizes (such as 2.0 degrees). In this way one can locate the transition state to +/- 2.0 degrees. A more precise localization of the transition state structure must, however, rely on a gradient optimization algorithm.
4) Driving a Bond Distance to Study Hydrogen Exchange Reactions
Driving a bond distance is one possibility to study reactions in which bonds are broken. The bonds chosen for stepwise variation are obviously those that participate in the bond breaking and making processes. As there is usually more than one bond that breaks during a reaction, selecting the one that is most descriptive of the reaction coordinate is not always straight forward. The example chosen here to illustrate the situation is the identity reaction of hydrogen radical H with molecular hydrogen H2. Using an internal coordinate system and restricting the overall system to be linear (for the relevant part of the PES this is not much of a simplification) there are only two geometrical variables r3 and r4 left decribing the distances between the central hydrogen atom and the two outer hydrogen atoms:
Optimization of both distance variables at the HF/6-31G(d) level of theory leads to localization of a ground state reactant complex GS(R) with r3=72.9971 pm and r4=349.1454 pm. From this stationary point an attempt can be made to find the transition state for the exchange reaction through either stretching the short bond described by r3 or by shrinking the long bond described by r4 to shorter distances. While one could imagine these two options to be more or less equivalent in an identity reaction, we will see in the following that this is not so.
Choosing r3 as our scanning variable and selecting larger and larger values for this variable starting from the optimized value of r3=72.991 pm corresponds to pushing the covalent bond between H1 and H3 apart. An input file for scanning this variable to r3=272.991 pm in 20 steps can be found here. The result of this effort is presented in the upper part of following figure. It can clearly be seen that elongation of the bond connecting H1 and H3 leads to a continous increase in energy. The magnitude of the energy increase is far larger than expected for a radical substitution reaction and reaches values at r3=270 pm that are far greater than those for typical bond cleavage processes (here > 700 kJ/mol). Even though this simple system poses quite some problems for a number of theoretical methods (for an overview see E. Proyonv, H. Chermette, D. R. Salahub, J. Chem. Phys.2000, 113, 10013), energies exceeding the experimentally measured reaction barrier of 40.6 kJ/mol (300K) by more than a factor of two may indicate that we are not heading for the transition state region in this type of scan.
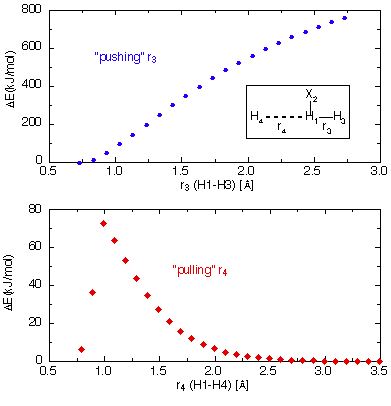
Choosing r4 as the scanning variable and selecting smaller and smaller values for this variable starting from the optimized value of r3=349.1454 pm corresponds to pulling the covalent bond between H1 and H4 together. An input file for scanning this variable to r4=79.1454 pm in 27 steps can be found here. The result of this scan is featured in the lower part of the figure above. Aproaching from larger distances the energy now rises much more slowly until reaching a maximum at about 100 pm and just over 70 kJ/mol. Further contraction of r4 leads to a sudden decrease in energy suggesting a discontinous or at least very irregularly shaped potential energy surface. Despite the fact that the energies are much more reasonable in this second scan, it is not clear whether the energy maximum now corresponds to a true transition state.
How can the results obtained in both scans be rationalized? Plotting the bond distances r3 and r4 against each other gives a better view of the relevant part of the potential energy surface. The following figure represents a birds eye view of the PES and also contains the true transition state for the hydrogen exchange reaction at r3 = r4 = 93.4598 pm and an energy of +75 kJ/mol relative to the reactant complex.
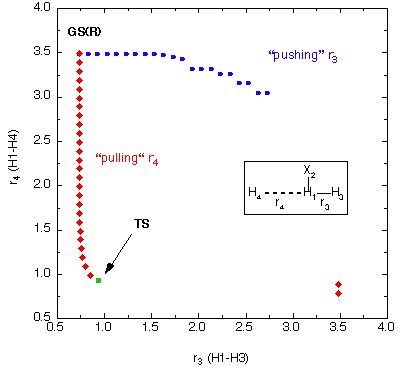
We can now see that pulling in r4 is a well chosen scanning coordinate directly aiming at the transition state in terms of its structure as well as its energy, and that it is only after passing beyond the transition state region that r4 is not a good description of the reaction pathway anymore. Pushing apart r3, on the other hand, represents the wrong direction right from the start and effectively ruptures the existing H-H bond without forming a new one.